Saltar al contenido principal

Keymets F&B: Power BI for restaurants

Keymets Business Intelligence also for restaurants and hospitality (HORECA): sales, products, time slots and cash discrepancies for all your venues in a single dashboard, built on Power BI and updated every day.
What you can analyse

Sales

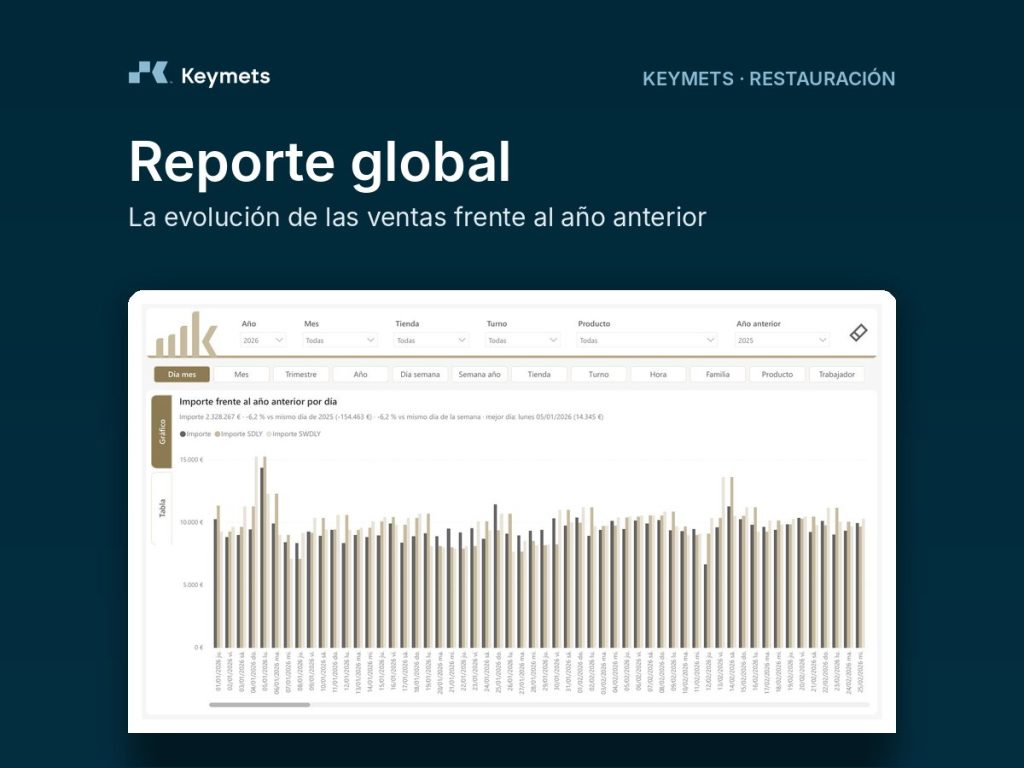
  • Global report: sales trends compared with last year.
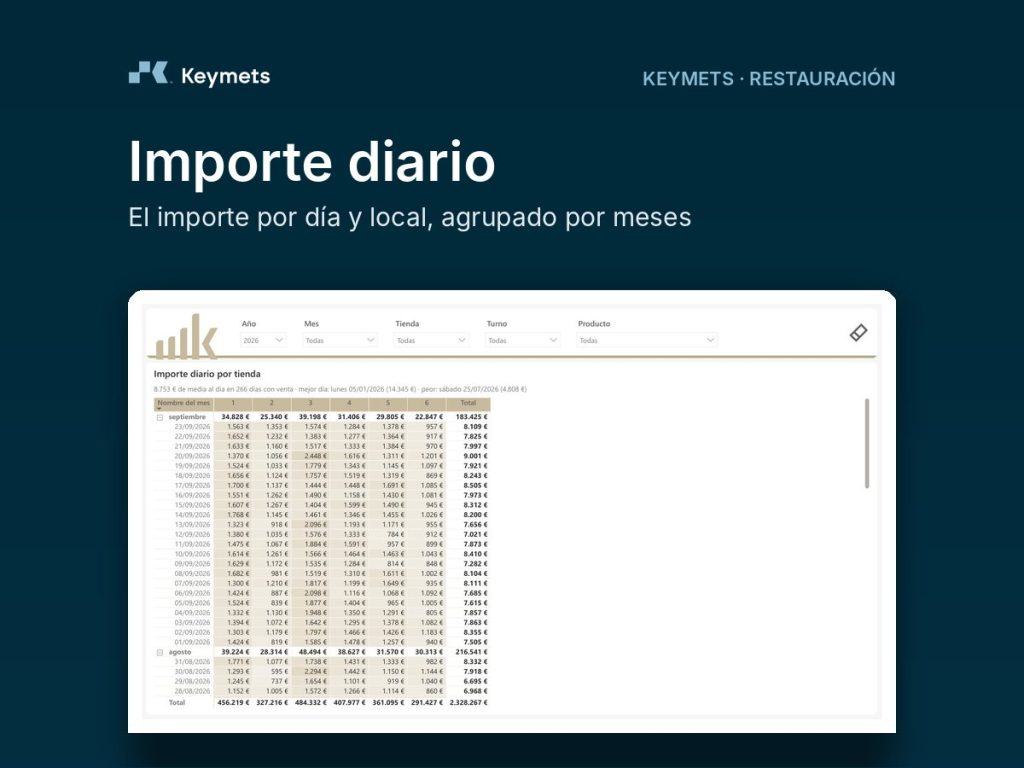
  • Daily revenue: revenue by day and venue, grouped by month.
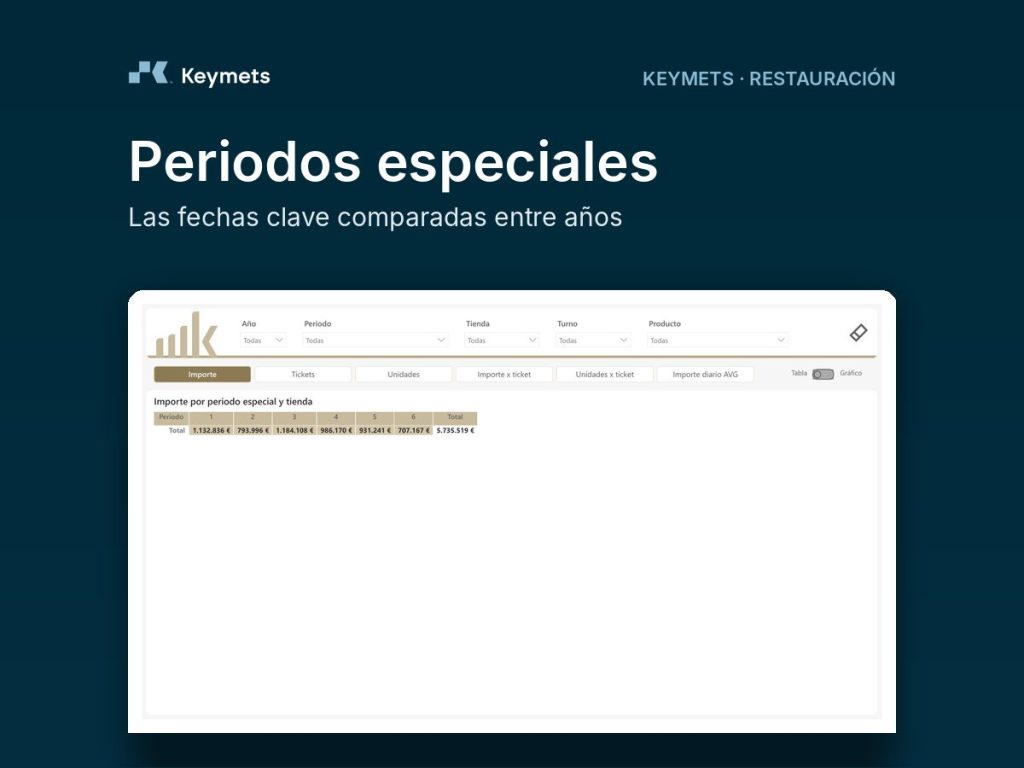
  • Special periods: key dates compared across years.
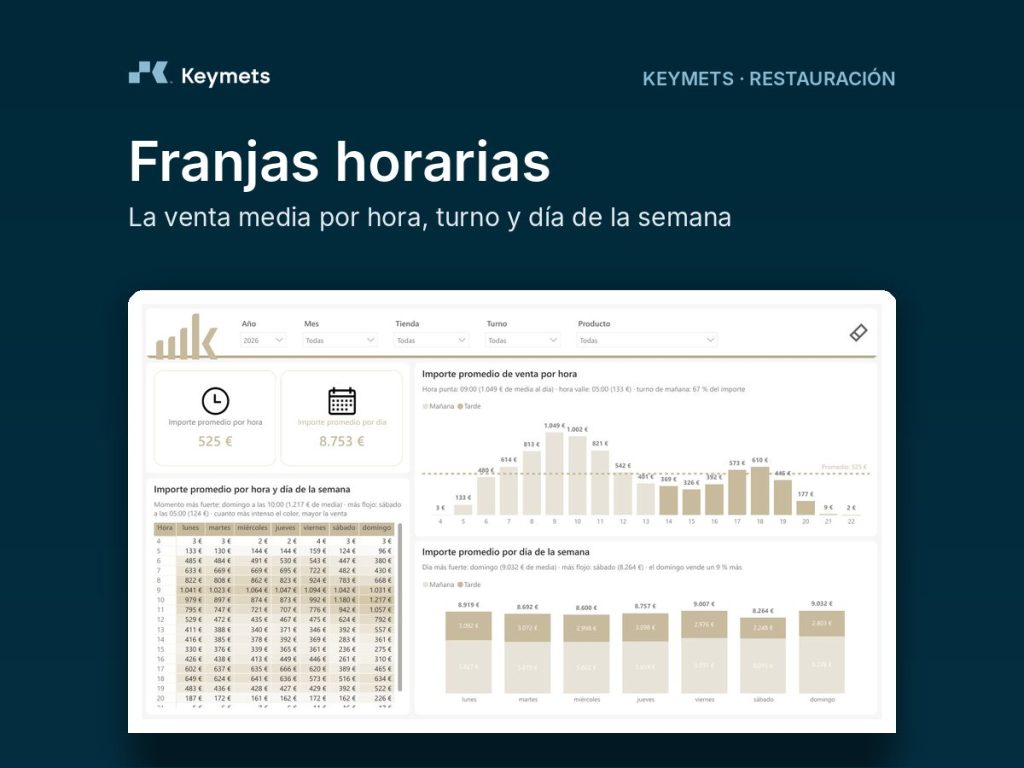
  • Time slots: sales by hour, shift and day of the week.

Venues and cash

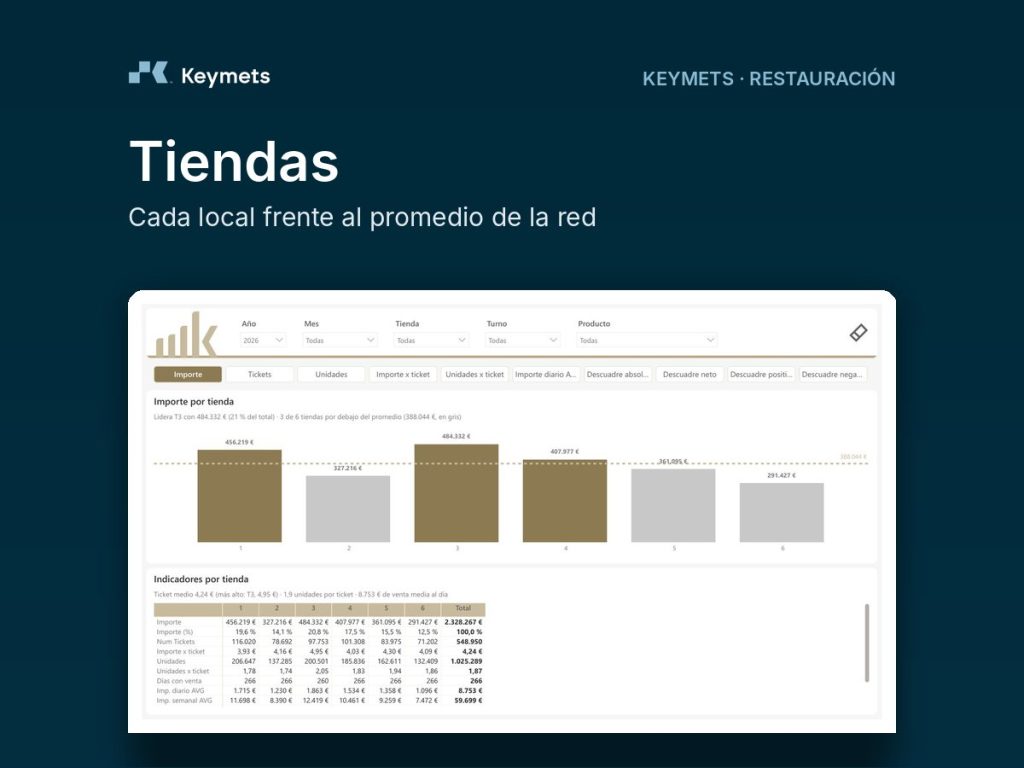
  • Stores: each venue compared with the network average.
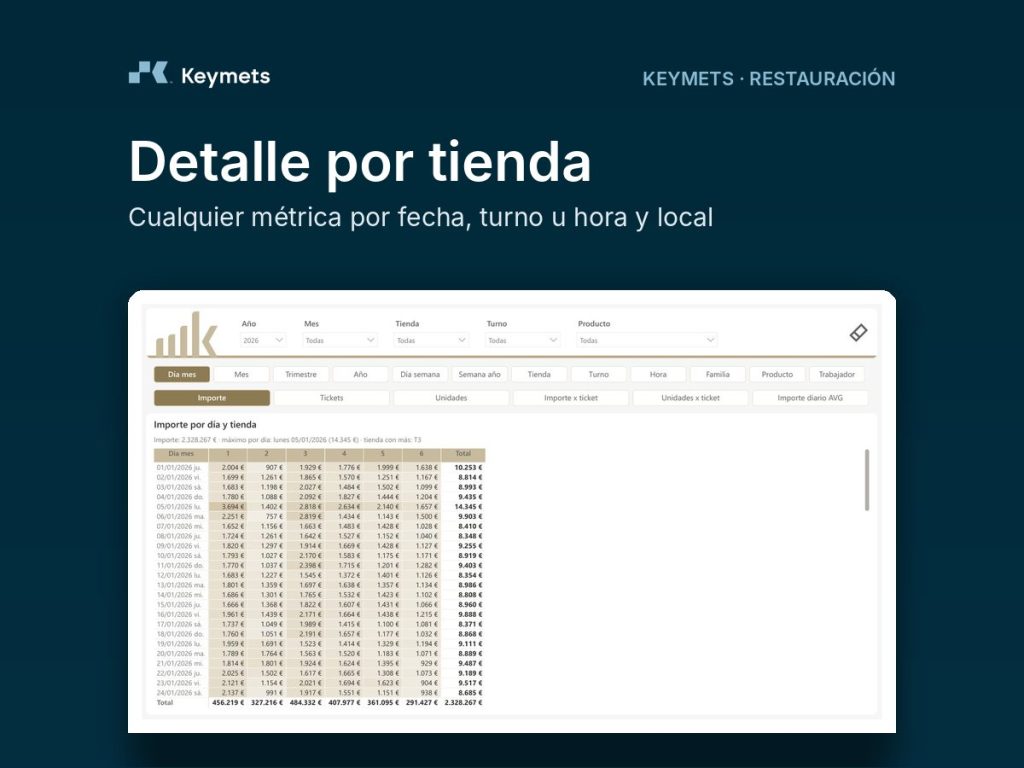
  • Store detail: any metric by date, shift or hour and venue.
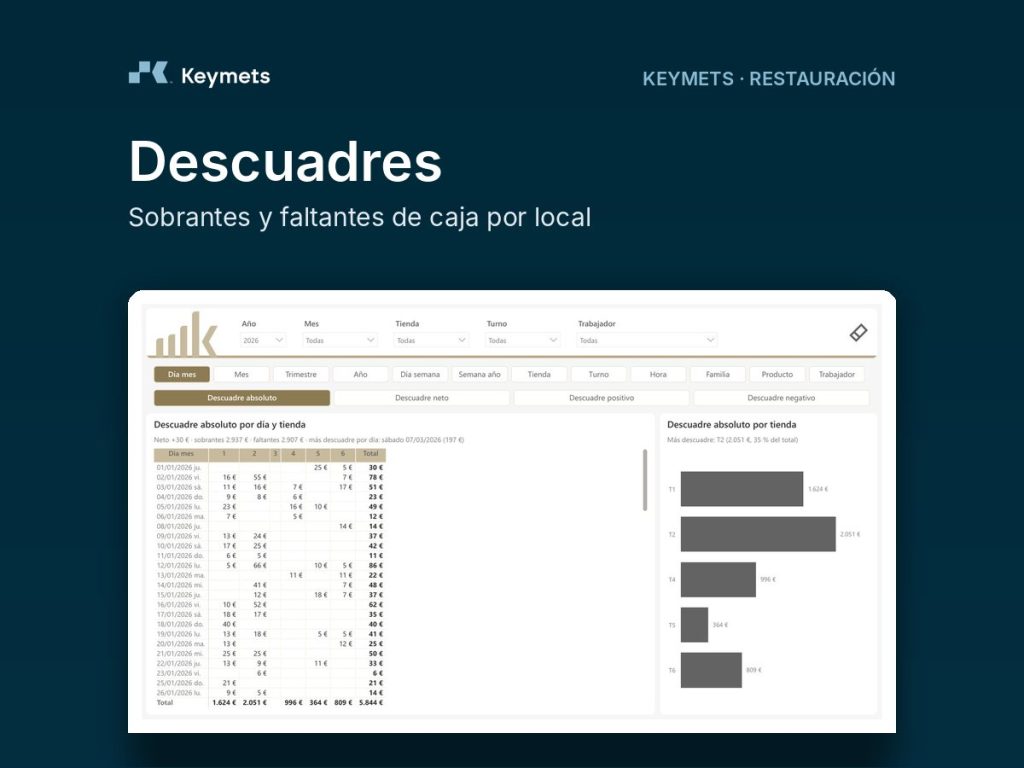
  • Cash discrepancies: cash overages and shortages by venue.
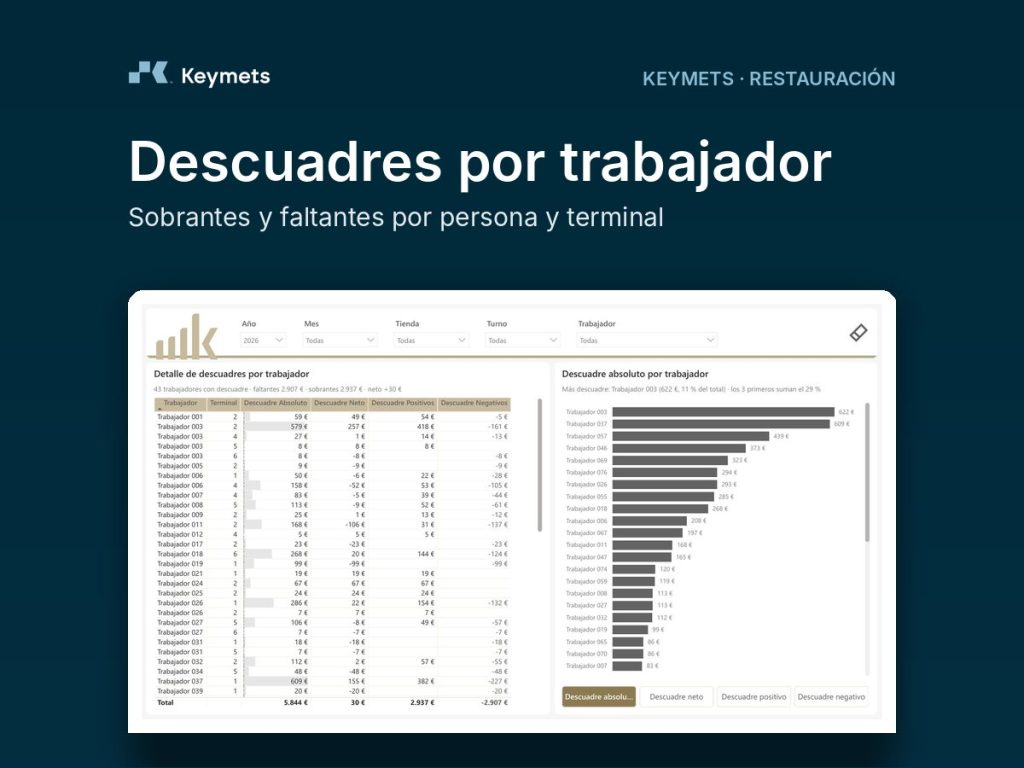
  • Discrepancies by employee: overages and shortages by person.

Products

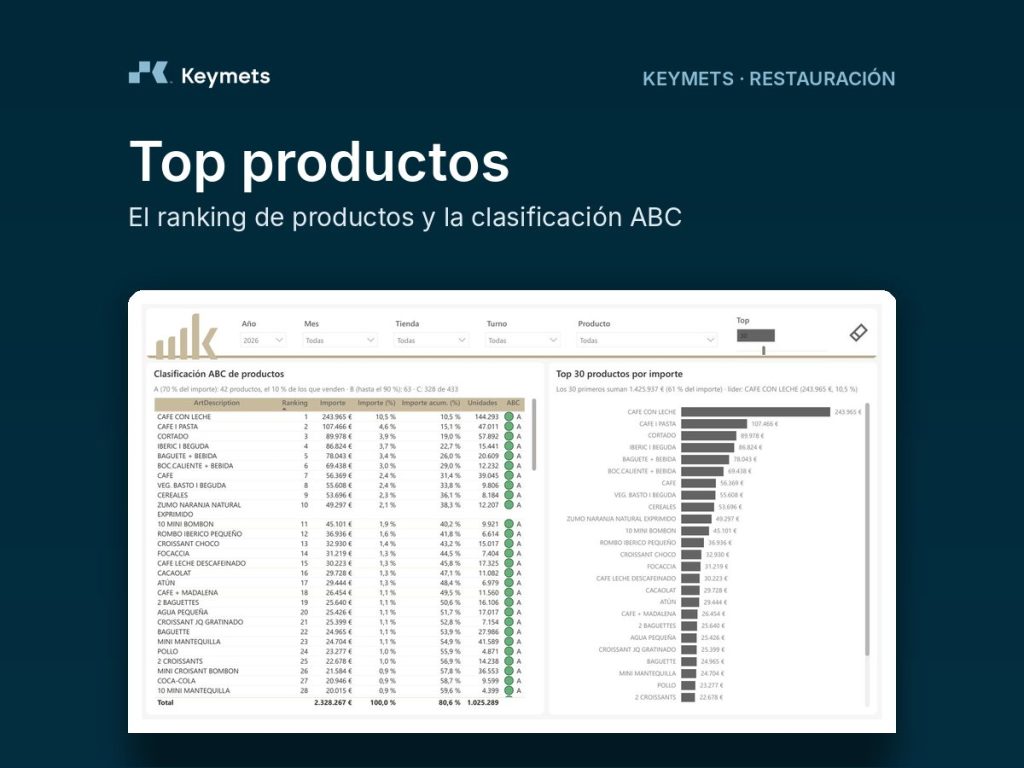
  • Top products: product ranking and ABC classification.
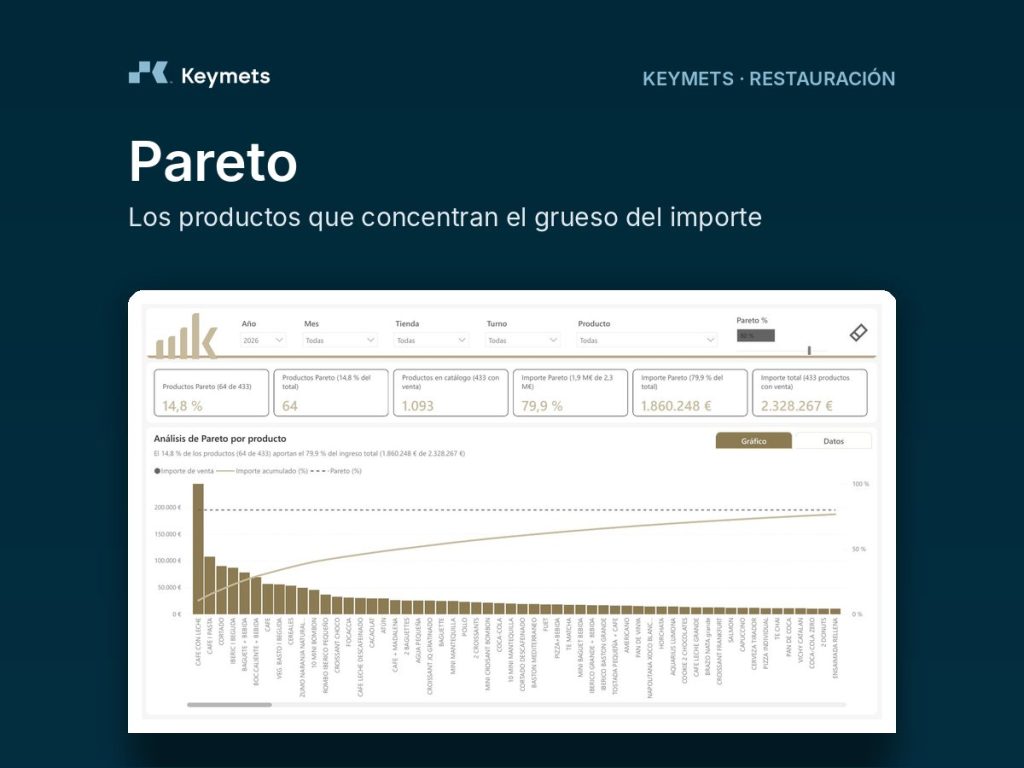
  • Pareto: the products that make up most of the revenue.
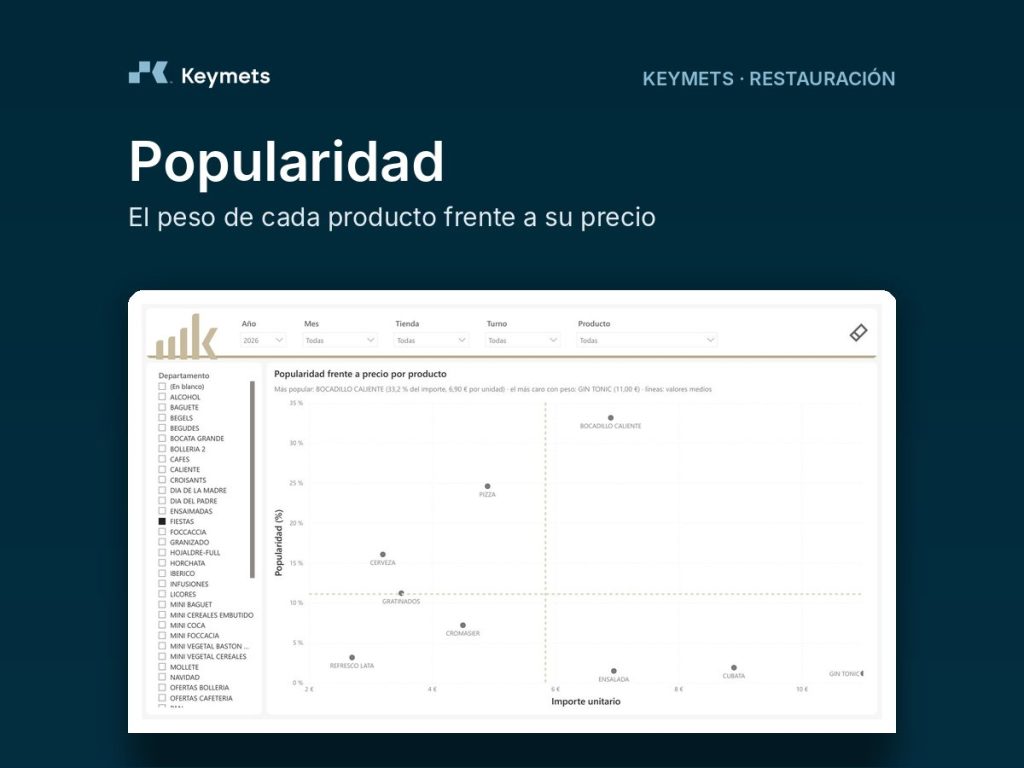
  • Popularity: the weight of each product compared with its price.

The reports, one by one

Each page explains what the report shows, which questions it answers and how to get the most out of it.

Built for groups and chains

Keymets F&B compares each venue with the rest of the network, detects cash discrepancies in time and tells you which products and hours sustain your business. Management, operations and every venue manager work with the same figures.

Quick insights and user guide

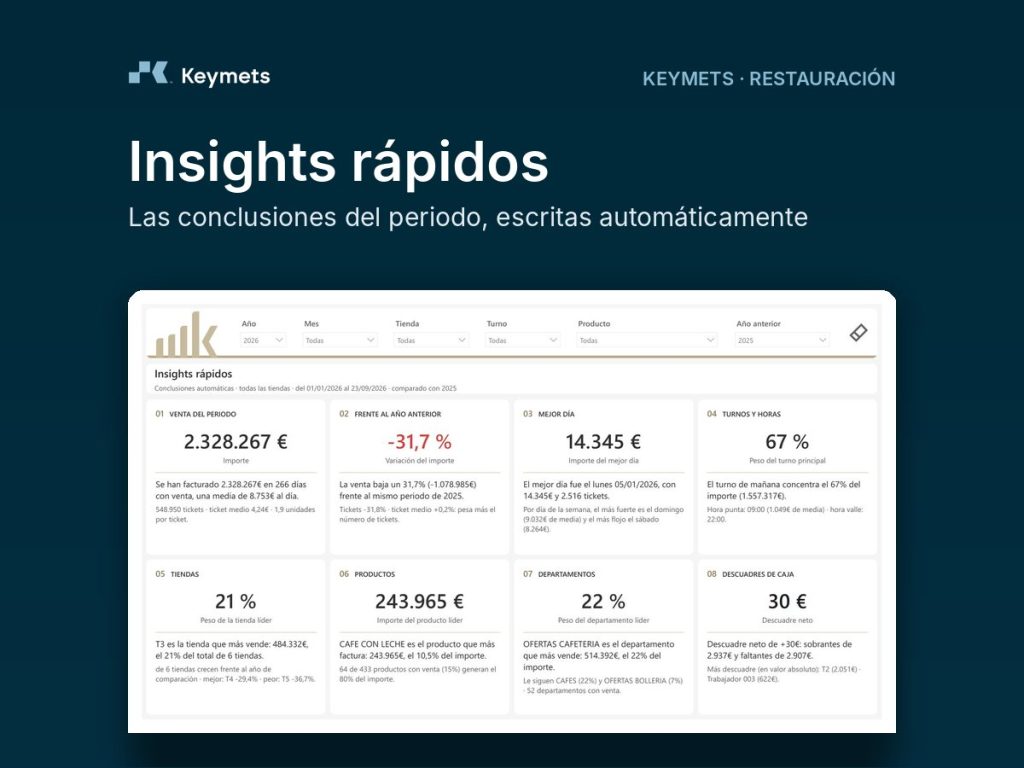
A page of automatic conclusions summarises the highlights of the period, and a built-in guide explains every visual to the whole team.

How we start

  1. We analyse what you need to know about your sales and your venues.
  2. We connect the data from your POS and other sources.
  3. We build your Power BI report with your venues, products and shifts.
  4. You receive your data updated every day.